Reports, analytics and the data explorer
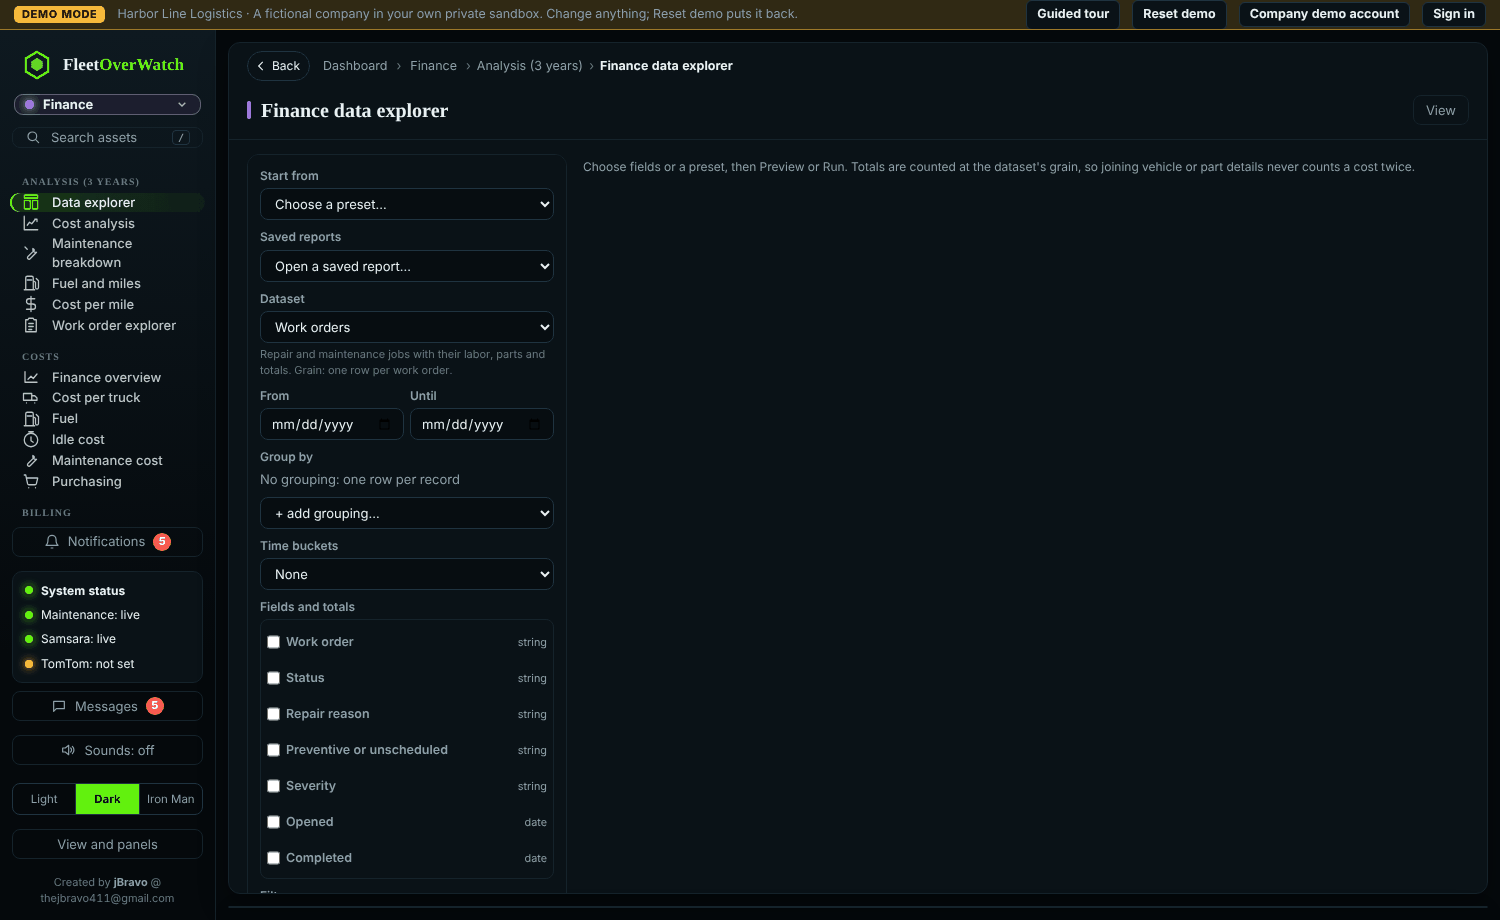
- Choose a preset or a dataset (work orders, fuel, parts used, expenses, issues...). Each dataset says its grain (what one row is), so totals never count a cost twice.
- Set the date range, group by fields and time buckets (day, week, month).
- Tick the fields and totals you want; add filters.
- Run. Select a bar or row to see the records behind it (drill-down).
- Compare another period or dataset if needed.
- Save the report (private or shared), or Export to CSV, Excel (with a definitions sheet) or PDF (with charts).
Missing values are reported, and every result shows the date the data runs through.
Something here out of date or unclear? Tell your administrator and mention “reports” and version 4.9.2.