The command dashboard
The command dashboard is the home page for admins and managers (and the demo's home page). Every number is counted from your records when the page loads and refreshes every two minutes; select any card or line to open the records behind it.
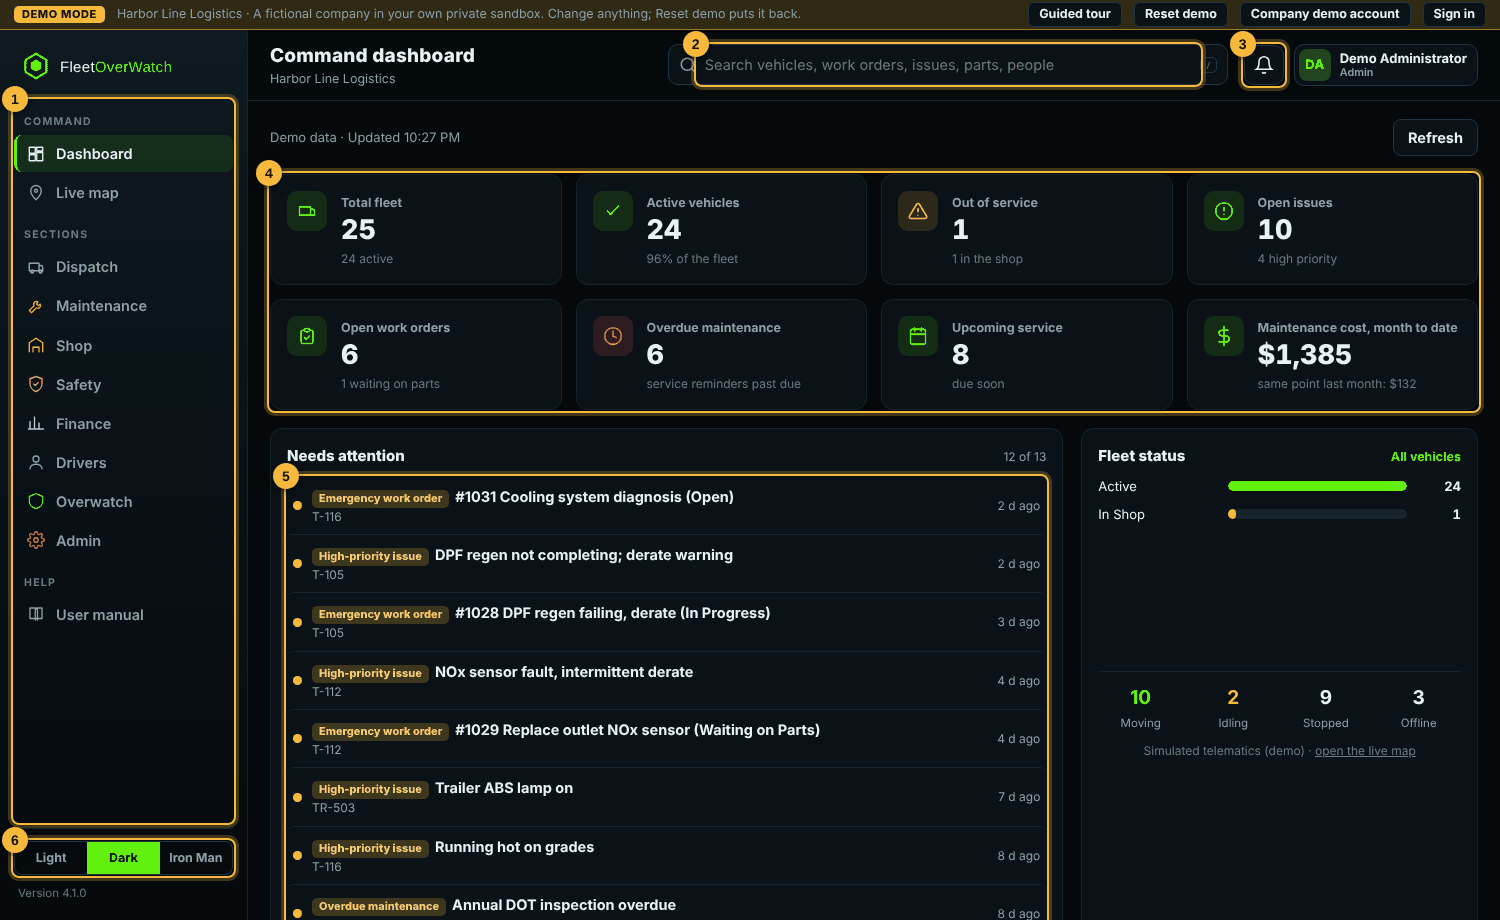
Summary cards #
| Card | What it counts |
|---|---|
| Total fleet | vehicles that are not archived |
| Active vehicles | vehicles with status Active |
| Out of service | vehicles Out of Service or In Shop |
| Open issues | issues Open or In Progress (high priority shown underneath) |
| Open work orders | work orders not Completed or Cancelled (waiting on parts underneath) |
| Overdue maintenance | active service reminders past due |
| Upcoming service | reminders due soon |
| Maintenance cost, month to date | completed service this month, with the same point last month for comparison |
Needs attention #
The list ranks what to deal with first: critical defects, vehicles out of service, emergency work orders, high-priority issues, overdue maintenance and parts that are short for an open repair. Red means critical, amber a warning. The count shows how many items there are in total.
Charts and recent activity #
- Fleet status: vehicles by status, plus live counts (moving, idling, stopped, offline) from telematics.
- Costs by month: fuel, service and other expenses for the last 12 months. Point at a bar for the figures.
- Preventive maintenance: overdue, due soon and up to date.
- Work orders opened and completed by month, and parts inventory (in stock, low, out).
- Recent issues, work orders, upcoming maintenance, inventory transactions and record changes. View all opens the full list.
Search everything #
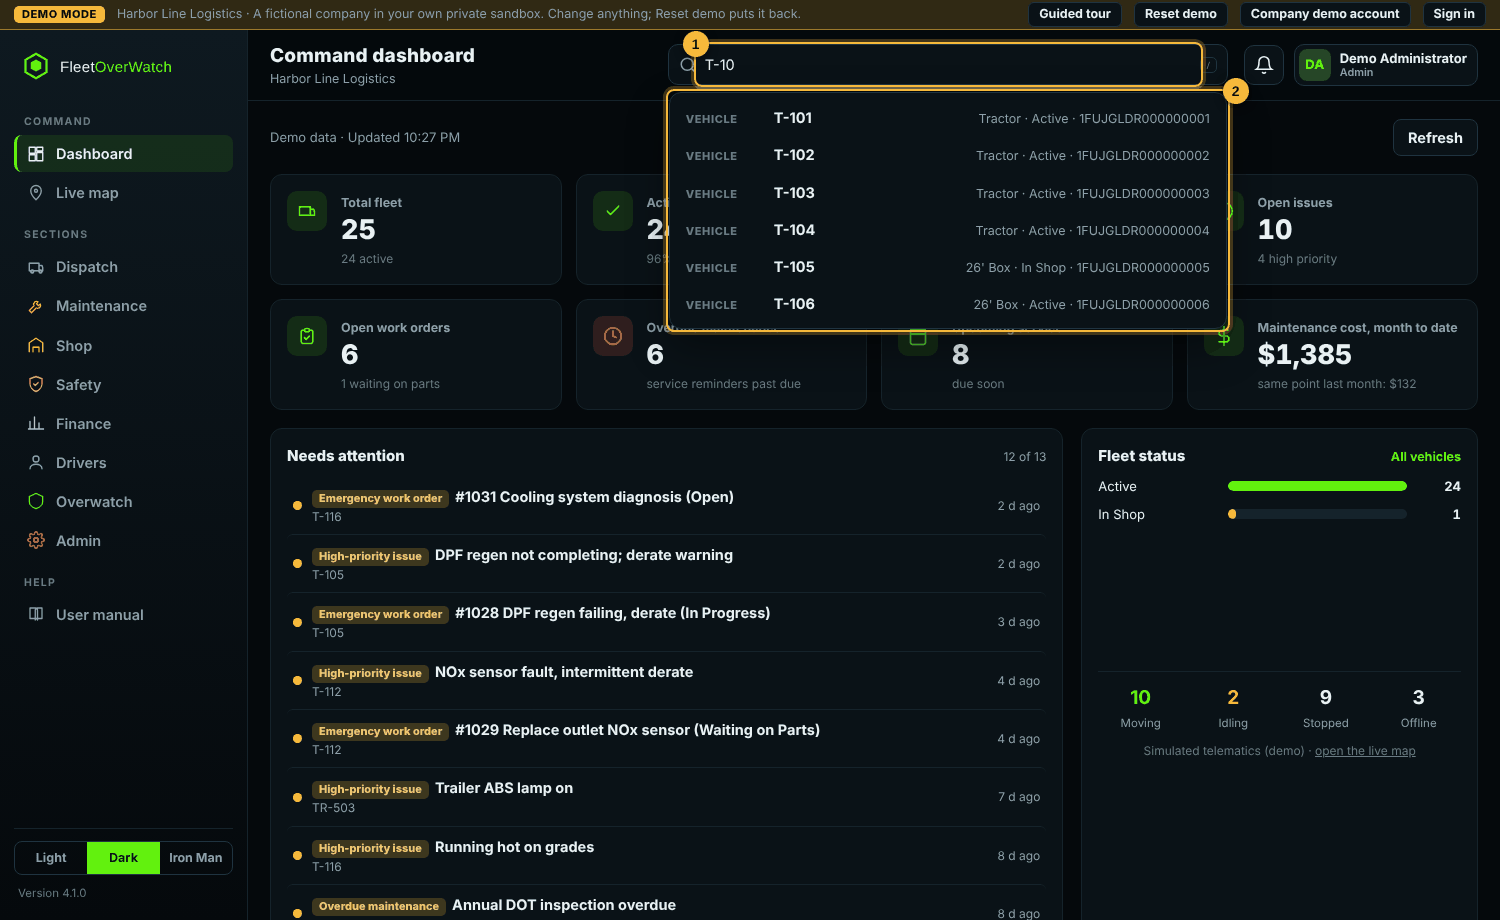
- Select the search box or press
/. - Type at least two letters: a unit number, VIN, plate, work order number, part number or a person's name.
- Use the arrow keys and Enter, or select a result, to open the record.
Notifications #
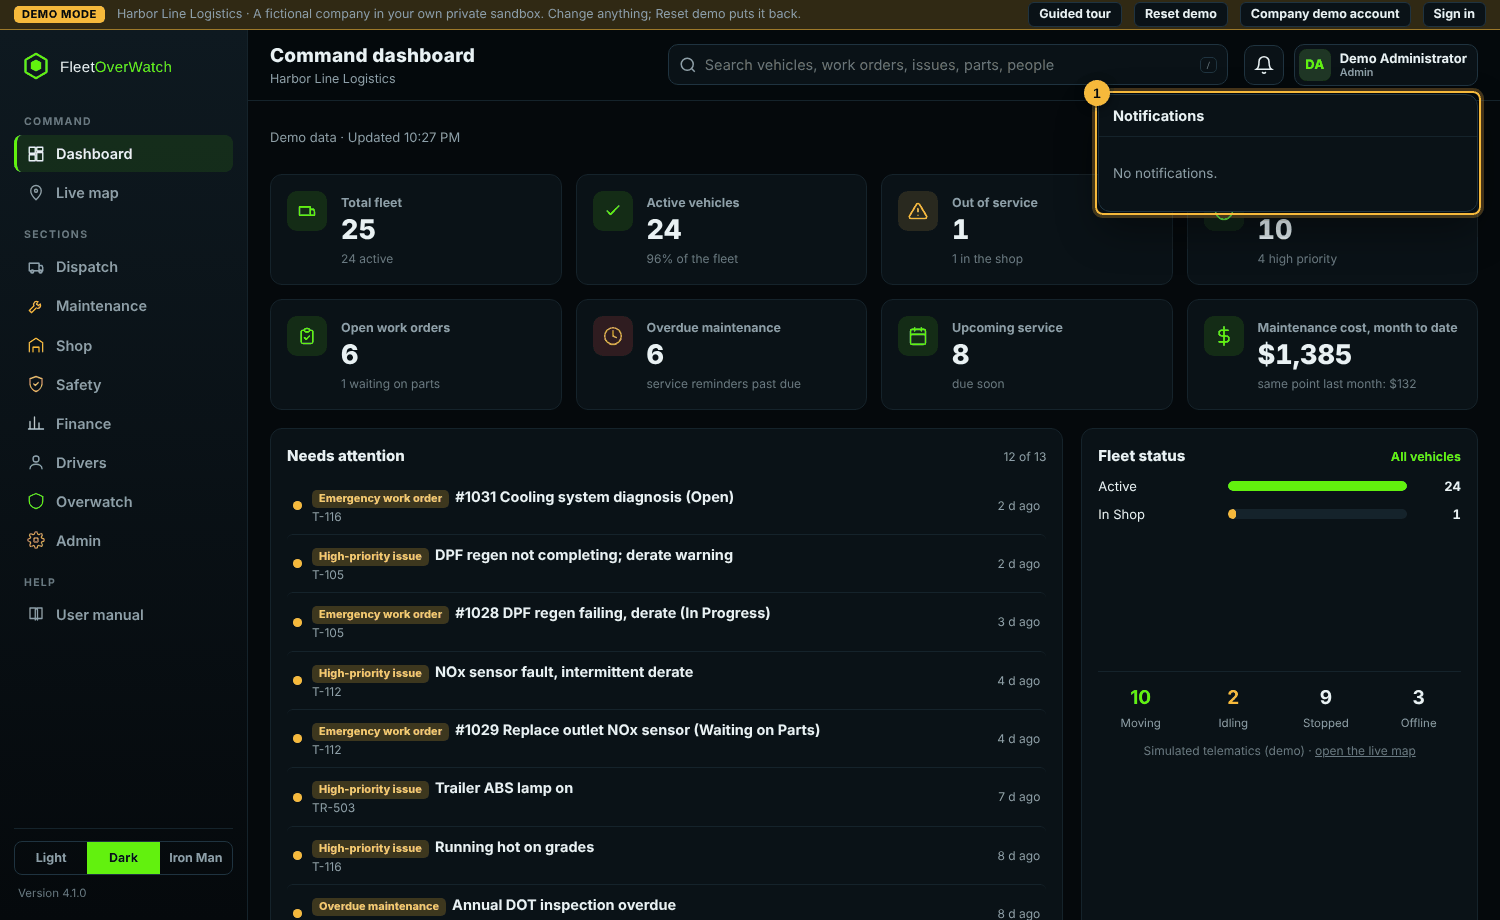
The bell shows how many notifications you have not read. They come from workflow rules (for example maintenance due or a critical defect), approvals and reminders. Mark all read clears the count.
If this does not work #
- "Could not load the dashboard": the server could not answer; select Refresh. If it continues, an administrator checks Admin > Health checks.
- Live counts unavailable: telematics is not connected or the background worker is stopped (see Health monitoring). The record figures still work.
- The Globe view (left menu) is the earlier animated hub; it shows the same sections.
Something here out of date or unclear? Tell your administrator and mention “dashboard” and version 4.9.2.